Loading...
Loading...


Stay up to date
Stay up to date
Follow us

There is no data on 35, Oxford Street, London but you can login to provide an accurate description to improve estimates in the area.
Oxford Street, London, W1 is located in the borough of City of Westminster within the W1 postal district.

35, Oxford Street, London has no recent1 records in either the Land Registry or EPC databases.
We can use information from neighbouring properties to estimate the attributes and values.

There is limited information for 35 Oxford Street London so we cannot provide any value estimates.
Please update the property information so that when future pricing information becomes available we can generate price estimates.
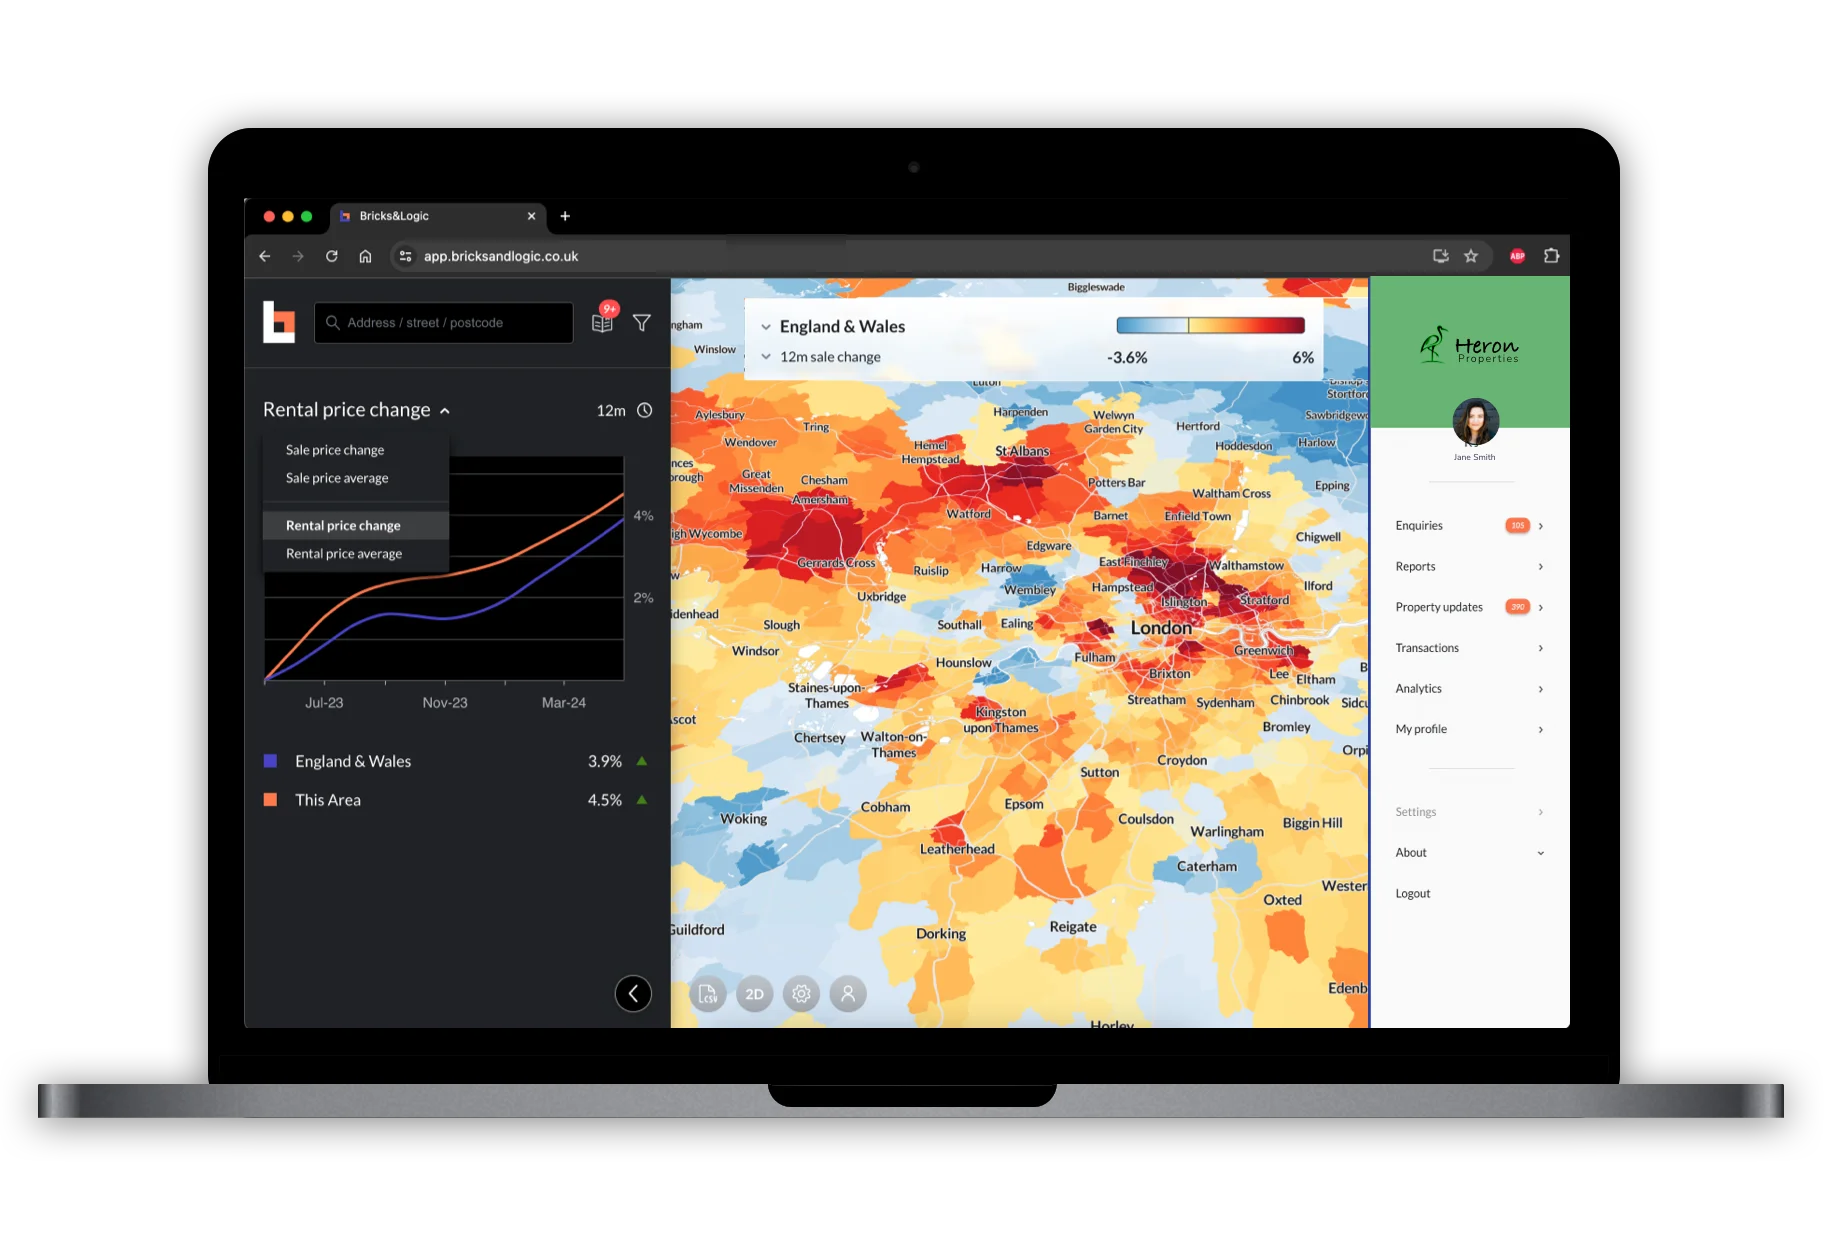
However, over the last 12 months properties in the area have seen their sale values increase by 1.3% and their rental values increase by 7.9%.

This figure is only an estimate but we've partnered with Mortgage Advice Bureau who can provide a figure tailored for you! Get started using their mortgage finder below.

According to HM Land Registry, 35, Oxford Street, London was last sold on 04 Nov 2003 for £2,450,000 and was recorded as a freehold house.
The property has only had this single sale since 1995.

According to the Land Registry and our network of Estate Agents, there have been 3 property sales within a 68m radius of 35, Oxford Street, London over the last 2 years.
The most recent example is Flat 15, 49, Hanway Street, London, W1T 1AY, a Leasehold flat which sold for £2,050,000 in Dec 2022.
Read more about house prices in W1.

Oxford Street, London, W1 has a total of 135 addresses. According to our analysis of all the public data, 35, Oxford Street, London is the 65th largest and the 79th most expensive property on the street.
When compared to the postcode district it is £31k more expensive than the average property in W1.


The closest station to 35, Oxford Street, London is Tottenham Court Road (Elizabeth line) station which is 100 m away.

According to data from the Environment Agency, the flood risk in this area is considered to be very low.

The recent census recorded whether a resident owned or rented their home.
In the area around 35, Oxford Street, London, 66.9% of property is privately rented and 13.2% is privately owned outright.
The graph below shows how this compares to Greater London and the rest of England & Wales.

The recent census recorded the highest level of education achieved by residents in the local area.
In the area around 35, Oxford Street, London, 30.2% of residents are recorded as possessing school level qualifications and 69.0% as possessing degree level qualifications.
The graph below shows how this compares to Greater London and the rest of England & Wales

The most recent census in 2021 recorded the age of all UK residents.
In the area around 35, Oxford Street, London, the average age was 37.9 and the most common age was 22.
The graph below shows how this compares to Greater London and the rest of England & Wales

The recent census recorded whether a property was a primary or secondary home for the resident.
In the area around 35, Oxford Street, London, 3.4% of property was a second home.
Comparison figures for Greater London and the rest of England & Wales are listed below.

The recent census recorded the number of cars registered in each household.
In the area around 35, Oxford Street, London, there are an average of 0.2 cars per household.
See below for how this compares to Greater London and the rest of England & Wales.